Ditch Digital Dead-Ends: Data-Driven Decisions for Dealerships
Ditch digital dead-ends by replacing vendor "gut feel" with data-driven accountability. By consolidating siloed reports into one unified view, dealerships can automatically surface High Conversion Performers and eliminate wasted spend. Discover the single metric that translates complex vendor noise into actionable profit.


At a Glance: Stop silo-hopping between 40 different vendor dashboards. This guide explains how to use a unified Engagement Score and the ASC Standard to identify budget leaks, eliminate "digital tourists," and double down on high-conversion traffic.
The Empty Showroom Problem
"My reports say it’s working, but my showroom is empty. What gives?"
Most dealerships are juggling 20, 30, even 40 vendor relationships at once — each with its own dashboard, its own metrics, and its own very compelling story about why their numbers look great. The problem? Every vendor is measuring success differently, reporting in their own portal, and conveniently leaving out the data that doesn't flatter them.
Meanwhile, you're writing checks.
Dealer Insights' Vendor Analysis feature was built to end the guesswork. It pulls your vendor performance data into one unified view — scored, ranked, trended, and laid out in plain English — so you can finally see which vendors are earning their place in your budget and which ones are quietly coasting on it.
One Dashboard. Every Vendor. No More Silo Hopping.
The moment you open Vendor Analysis, the noise disappears. At the top of the page, you get a snapshot of what matters most across your entire vendor ecosystem over your selected date range:
- Total Leads generated across all vendors
- Total VDP Views driven to your inventory pages
- Total Ad Spend tracked across paid vendors
- Top Performers by both leads and VDP views — identified automatically, no manual sorting required
This is your 30,000-foot view. But the power is in what comes next.
Engagement Score: A Single Number to Cut Through the Noise
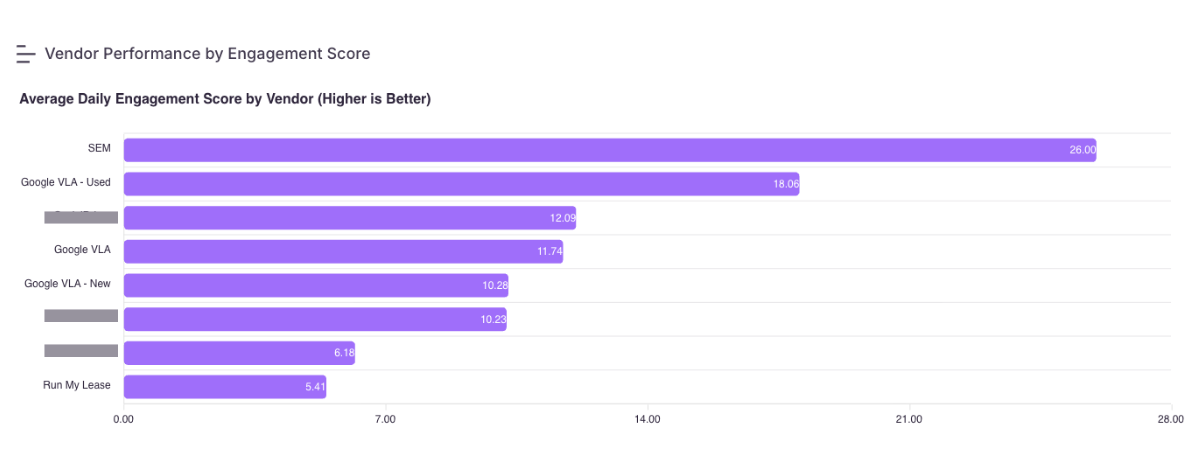
One of the most valuable things Vendor Analysis does is translate complex, multi-variable vendor performance into a single, comparable metric: the Average Daily Engagement Score.
The Engagement Score is calculated from how effectively a vendor drives meaningful user behavior on your website — not just traffic volume, but quality of interaction. This levels the playing field between vendors who send massive amounts of traffic versus those who send smaller audiences that actually engage with your inventory.
The result is a ranked bar chart that lets you see, at a glance, which vendors are delivering real engagement and which are inflating vanity metrics. When you can see SEM scoring 26.27 sitting beside a vendor scoring 5.66, the conversation with your vendors shifts immediately from "we drove 100,000 impressions" to "yes, but what did those impressions actually do?" This is the kind of clarity that changes budget decisions.
Metric Trends Over Time: Stop Making Decisions on Last Month's Data
Averages are useful. Trends are actionable.
The Metric Trends Over Time section lets you select any combination of vendors and plot their performance — VDP Views, Leads, Users, and more — across a daily timeline. This means you can:
- Spot a vendor that was performing in Q4 but has been declining in Q1
- Identify seasonal patterns in how different traffic sources behave
- Catch a vendor drop-off that their monthly report conveniently glossed over
- Compare how two vendors track side by side over the same time period
Instead of reacting to a vendor's summary report at the end of the month, you're watching performance as it unfolds — and you're doing it on your terms, with your data.
Distribution Views: Where Are Your Leads Really Coming From?
Two pie charts in the Vendor Analysis dashboard answer a question most dealers have never been able to answer confidently: which vendors are actually responsible for your VDP views and your leads?
The VDP Views Distribution chart breaks down what percentage of your total inventory page views each vendor is driving. The Leads Distribution chart shows how lead volume is attributed across your vendor mix.
Here's where it gets interesting. A vendor can rank high in VDP views and low in leads — or vice versa. Seeing both charts side by side reveals mismatches that would otherwise stay hidden inside separate reporting portals. When one vendor accounts for 14% of your VDP views but only 7% of your leads, that's a conversation worth having.
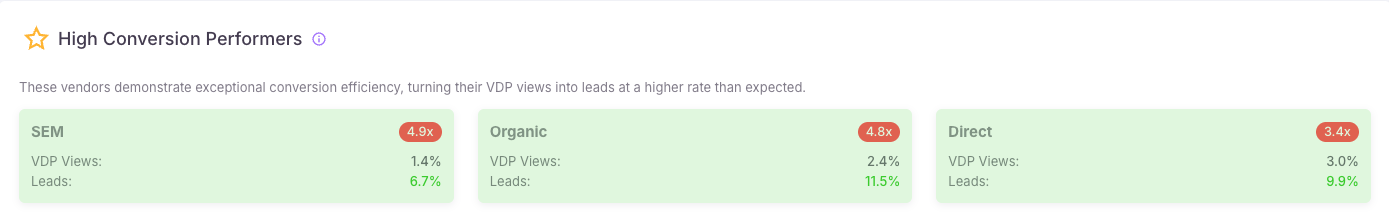
High Conversion Performers: Double Down on What Works
Not all traffic is created equal. Some vendors are exceptional at driving users who actually convert into leads — at a rate far above what you'd expect given the volume of traffic they send.
Vendor Analysis automatically identifies these High Conversion Performers and surfaces them with a conversion multiplier. A vendor showing a 5.0x conversion rate means they're converting leads at five times the expected rate relative to their VDP view share. That's remarkable efficiency, and it's exactly the kind of performance that deserves more investment — not a flat renewal negotiation. Knowing which vendors punch above their weight gives you a data-backed case to optimize your budget allocation rather than simply renewing contracts on autopilot.
Low Conversion Performers: The Vendors Costing You More Than You Think
On the flip side, Vendor Analysis also flags Low Conversion Performers — vendors who are driving significant VDP traffic but converting at a fraction of what their share of spend would suggest.
A vendor showing a 0.1x or 0.2x conversion rate is telling you something important: the traffic they're sending isn't the right traffic. Whether that's an audience targeting problem, a landing page alignment issue, or simply a vendor category that doesn't fit your market, you now have the data to address it — or reallocate the budget entirely.\

These aren't just optimization opportunities. In many cases, they're budget leaks.
Vendor Performance Details: The Full Picture, Side by Side
The Vendor Performance Details table is where all of this comes together. Every vendor in your ecosystem — all 30, or however many you're running — is listed in a single searchable, sortable table with five key columns:
- Total Leads
- VDP Views
- Users
- Average Engagement Score
- Ad Spend
This table is the great equalizer. For the first time, your SEM vendor, your third-party listing sites, your chat tool, your email campaigns, and your organic traffic are all evaluated by the same set of criteria in the same view. There's no more comparing apples to vendor-curated oranges.
And when a vendor shows up with significant ad spend, zero leads, zero VDP views, and zero users? That number is no longer buried in a line item — it's right there on the table, impossible to overlook.
From Gut Feel to Data-Driven Vendor Accountability
Vendor management at most dealerships is built on relationships, contracts, and a vague sense of whether things feel like they're working. Dealer Insights' Vendor Analysis feature replaces that guesswork with a structured, comprehensive, always-current view of every vendor relationship you're paying for.
You'll know who's earning their spend. You'll know who isn't. And you'll have the data to back up every conversation, every renegotiation, and every budget decision you make.
Because in today's market, "I think this vendor is performing well" isn't a strategy. Data is.
Frequently Asked Questions
What is a good engagement score for automotive vendors? While scores vary by source, a unified score allows you to compare top-tier SEM (e.g., 26.27) against lower-performing third-party sites (e.g., 5.66) to see who is driving real user behavior like photo flips and credit apps.
How do I identify a "budget leak" in my dealership marketing? A budget leak occurs when a vendor has a high share of VDP views but a disproportionately low share of leads (e.g., 14% views vs 7% leads) or a conversion multiplier below 0.5x.
What is the ASC Standard for automotive data? The ASC Standard is an industry-recognized framework for normalizing dealership data. Using this standard ensures that every vendor is evaluated by the same criteria, eliminating "apples to oranges" comparisons.