Is Your Dealership Paying for Bots? How to Audit Your Website Traffic
Your VDP numbers might look great — but how much of that traffic is actually real? Our Bot Likelihood Score analyzes four behavioral signals from Google Analytics 4 to separate genuine car shoppers from automated bots, so you can stop paying for fake results and start investing in what actually works.


That Traffic Isn’t Real
How to Spot Bot Activity on Your Dealership Website
Your analytics dashboard says thousands of shoppers viewed your VDPs last month. Your vendor says the campaign is crushing it. But here’s the uncomfortable question — how many of those “shoppers” were actually bots?
Bot traffic inflates your metrics, distorts your ROI, and can make an underperforming campaign look like a winner. And if you’re making budget decisions based on those numbers, you’re investing real dollars in fake results.
That’s exactly why we built a Bot Likelihood Score — a 0 to 20 point scoring system that separates real shopper behavior from automated noise, so you can finally see what’s actually working.
How the Bot Likelihood Score Works
Our system pulls directly from Google Analytics 4 and analyzes traffic behavior over the last 30 days. But instead of relying on a single metric, it evaluates four distinct behavioral signals that, when combined, reveal whether traffic is human or machine.
Think of it like a detective building a case. No single clue is conclusive — but when the evidence stacks up, the picture becomes impossible to ignore.
The Four Signals We Track
Signal 1: High Browsing, Low Engagement (Up to 10 Points)
Real car shoppers browse selectively. They land on a vehicle page, read the details, scroll through photos, and spend meaningful time deciding if it’s the right fit.
Bots? They rip through pages at machine speed without engaging with any of the content.
Here’s what triggers this signal:
- A visitor views far more vehicle pages than average while showing very low engagement — this is the single strongest bot indicator (10 points)
- A visitor views moderately more pages than average with below-average engagement (6 points)
- The ratio of engagement to browsing volume is abnormally low (4 points)
Our network benchmarks:
- Average VDPs per user: 0.88
- Average engagement score: 0.65
When VDPs per user climb above 1.76 while engagement drops below 0.33, that’s a textbook bot signature.
Signal 2: Low Photo and Media Interaction (Up to 5 Points)
When a real person shops for a car online, they look at the photos. They swipe through the gallery. They zoom in on the interior. They watch the walkaround video.
Bots don’t do any of that. They load the page and move on.
This signal fires when:
- There are fewer than 2 media interactions per vehicle page viewed (5 points)
- Media interactions fall well below the network average of 4.5 per VDP (3 points)
Signal 3: Low Call-to-Action Engagement (Up to 3 Points)
Are visitors clicking “Get ePrice,” “Schedule Test Drive,” “Value My Trade,” or “Click to Call”? Real shoppers interact with these buttons as part of their buying journey. Bots don’t click — they just load pages.
This signal fires when:
- There are fewer than 0.1 CTA clicks per vehicle page viewed (3 points)
- CTA engagement falls well below the network average of 0.34 per VDP (1 point)
Signal 4: Zero or Near-Zero Conversions (Up to 2 Points)
This is the ultimate reality check. If a source is sending hundreds of visitors to your VDPs and not a single one submits a form or picks up the phone — something is wrong.
This signal fires when:
- There are absolutely zero conversions despite meaningful traffic volume (2 points)
- The conversion rate is under 0.1% (1 point)
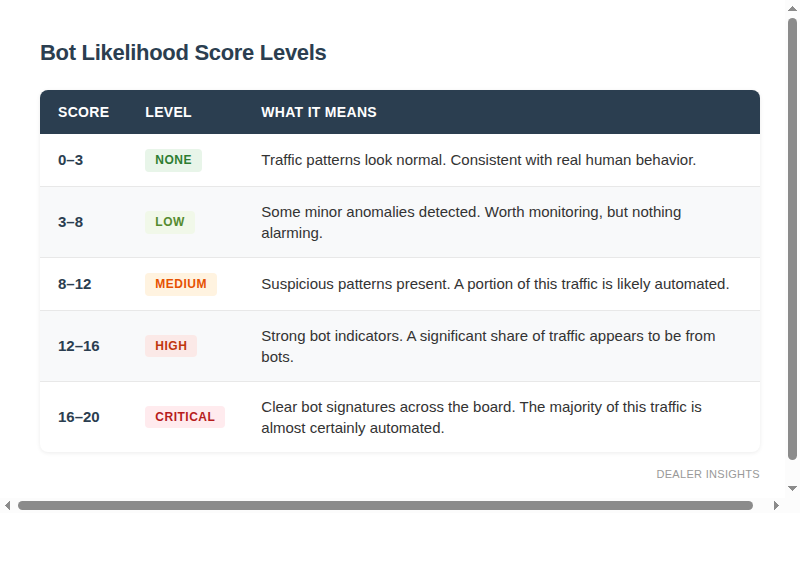
What Your Score Means
The four signals add up to a score between 0 and 20, which we translate into five levels:
What Bot Traffic Actually Looks Like: Let’s compare two real examples from our dealership network.
Dealership A — Critical Score: 20 out of 20

Every signal fires. Visitors are viewing nearly 3x more pages than normal but engaging at a fraction of the rate. Nobody views photos. Nobody clicks buttons. Nobody converts. This traffic is almost entirely automated.
Dealership B — Clean Score: 0 out of 20

This is what real car shoppers look like. They browse selectively, spend time on each page, view photos, click buttons, and a healthy percentage submit leads.
Where the Data Comes From
Our bot detection pulls directly from Google Analytics 4 to analyze actual visitor behavior on your website, including:
- Page views — How many VDPs are being loaded
- User counts — How many unique visitors are viewing those pages
- Engagement events — Scrolling, time on page, and other interaction signals
- Media events — Photo gallery views, video plays, and image interactions
- CTA events — Button clicks for pricing, test drives, trade-ins, and calls
- Lead data — Form submissions, phone calls, and chat conversations
All of this is analyzed over a rolling 30-day window to smooth out daily fluctuations and give you a reliable, consistent picture.
What to Do If Your Score Is Medium or Higher
Identify the source. We break down bot scores by traffic source and advertising vendor, so you can pinpoint exactly which campaigns or channels are sending low-quality traffic.
Have the conversation with your vendors. Armed with this data, you can sit down with your advertising partners and ask the hard questions about traffic quality. If a vendor’s traffic consistently shows bot signatures, that’s a red flag you can’t afford to ignore.
Redirect your budget. Stop paying for traffic that isn’t real. Move that ad spend toward channels that are driving genuine engagement and actual leads.
Keep monitoring. Bot patterns shift. A source that’s clean today might not be clean next month. Regular monitoring keeps you ahead of the problem before it drains your budget.
Why This Matters for Your Bottom Line
Every dollar you spend on advertising should drive real shoppers to your lot. When bot traffic inflates your metrics, it creates a false sense of success. Inflated VDP counts make campaigns look like they’re performing. Distorted cost-per-VDP hides the true cost of reaching real shoppers. And skewed ROI calculations can lead you to invest even more in channels that aren’t actually working.
By separating real traffic from bot traffic, you get an honest view of your marketing performance — and can finally make smarter decisions about where to invest.