Your SEM Budget Is Hiding a Problem: How to Audit Your Vendor's Performance
Your Google Ads campaigns may look organized — but are they actually working the way you think? Discover how Dealer Insights automatically classifies every keyword in your SEM account by what it's actually doing, so you can stop paying for clicks you don't need and start investing where it counts.
.png)


Your SEM Budget Is Hiding a Problem: How to Audit Your Vendor's Performance
Quick Take: Key Takeaways Summary
The "Brand" Trap: Many SEM vendors pad performance metrics by bidding on your dealership’s own name, capturing traffic you would have likely received organically for free.
Engagement > Clicks: A high click-through rate (CTR) is meaningless if it leads to low VDP (Vehicle Detail Page) views or poor engagement scores.
The Attribution Gap: Without ASC-standardized event tracking, you cannot verify if a "lead" reported by a vendor actually resulted in a high-value website action like a trade-in appraisal or credit app.
Data-Driven Conquesting: Use proprietary Dealer Insights benchmarks to identify underperforming vendors and reallocate that budget toward high-converting "conquest" campaigns.
Article
Your Google Ads account probably looks organized. Separate campaigns for New Inventory, Used Inventory, Service, and Branding. Clean labels, clear intent — or so it appears. What the campaign structure doesn’t tell you is which keywords are actually consuming your budget, and whether those keywords are doing the work you think they are.
A large dealer group recently discovered something they hadn’t expected: nearly half the spend inside their New Inventory campaigns was going to branded search terms — people typing in the name of their stores or the manufacturer’s brand. Those are searches the stores would have shown up for organically. They were paying for clicks they didn’t need to buy, out of a budget that was supposed to be selling new vehicles.
Nobody caught it because it wasn’t obvious. The campaigns were named correctly. The monthly reports looked fine. The money was just quietly going to the wrong place.
The Problem Isn't Anyone's Fault. It's the Structure of Google Ads Itself.
Google Ads organizes spending at the campaign level. But keywords don't have to match a campaign's stated purpose — any keyword can live inside any campaign, and unless someone manually reviews each keyword and categorizes it by hand, the mismatch is invisible.
That manual review is genuinely difficult work. An account with 300 active keywords across 12 campaigns could take hours to properly audit — and that's before you've done anything with the findings. For an agency managing 20 accounts, or a marketing director covering a group of 25 rooftops, it's a task that rarely gets done thoroughly. Not because nobody cares, but because there's never been a fast way to do it.
The result is predictable: budget allocations that look intentional from the outside but have drifted significantly from the actual strategy. A "Conquest" campaign that's mostly running on branded terms. A "Service" budget partly funding New Inventory searches. Spend that was meant to pull in new customers quietly reinforcing awareness among people who are already looking for you specifically.
Seeing Through the Campaign Structure
Dealer Insights now automatically examines every keyword in your Google Ads account and classifies it into one of 12 categories based on what it's actually doing:
New Inventory · Used Inventory · Branded (Dealership Name) · Branded (OEM) · Conquest · Service · Financing and Incentives · Electric & Hybrid Vehicles · Local Intent · Spanish/Bilingual · Remarketing · Event-Based
This classification happens at the keyword level — not the campaign level. A branded keyword hiding inside a New Inventory campaign gets flagged as Branded, regardless of where it lives. An inventory keyword inside a general campaign gets credited to inventory. The budget picture that emerges reflects what your money is actually buying.
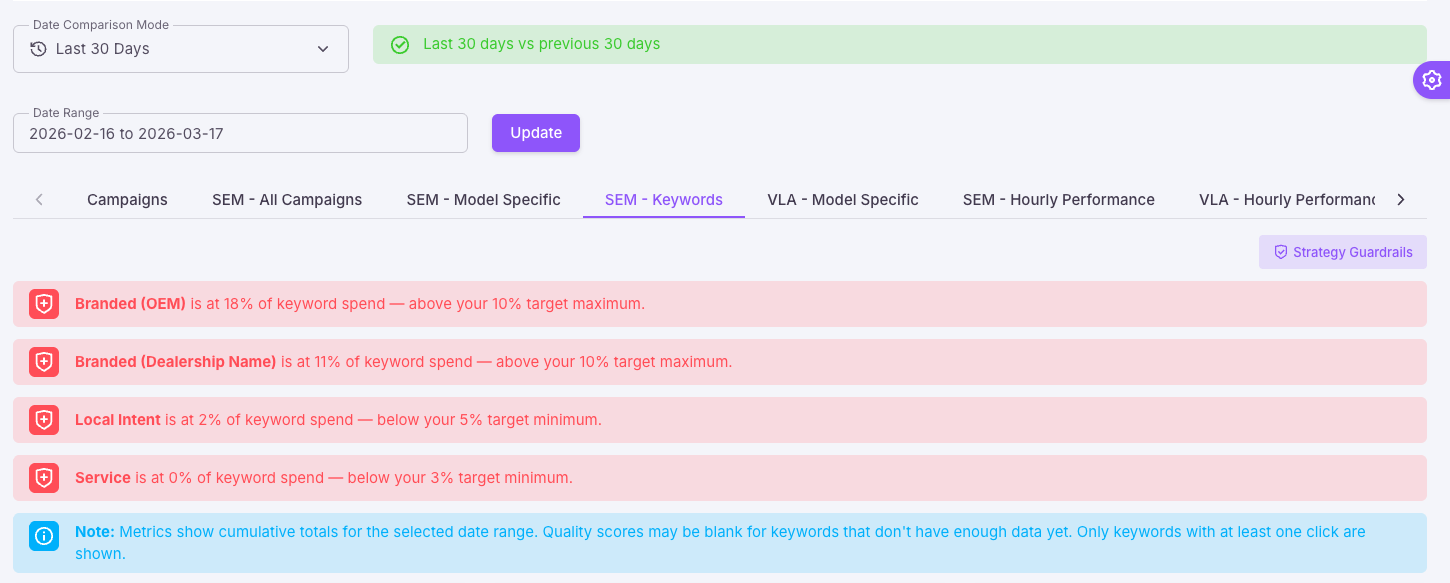
The SEM Keywords tab in our Google Ads feature breaks down your Google Ads spend by what each keyword is actually doing — not just which campaign it's in. Trend indicators show how each category's share of spend is changing compared to the prior period. Guardrail alerts at the top flag any category that's outside its target range.
Most dealers think their budget is working harder than it actually is. In this case, Dealer Insights revealed that spend was quietly concentrated in branded terms while high-opportunity categories like Local Intent were underfunded. With clear visibility at the keyword level, the dealer can reallocate spend, reduce waste, and drive stronger, more balanced results.
Setting a Strategy and Knowing When It's Not Being Followed
Knowing where your budget is going is the first step. The second is having a target — and knowing when you've drifted from it.
Strategy Guardrails let you define, for each keyword category, the minimum and maximum percentage of your total Google Ads spend that should be going there. A reasonable starting point for most dealers: New Inventory between 20–50%, Branded (Dealership Name) between 5–15%, Conquest no more than 10%. Every store's mix will be different based on market, inventory, and goals — the point is to have the strategy written down and measurable.
Once those targets are set, Dealer Insights monitors your keyword spend continuously. If a category drifts outside its range — whether it's creeping too high or being starved of budget — you get an alert through the same system you're already using for pacing and performance issues. You don't have to log in and check. The check happens for you.

One View for Every Store
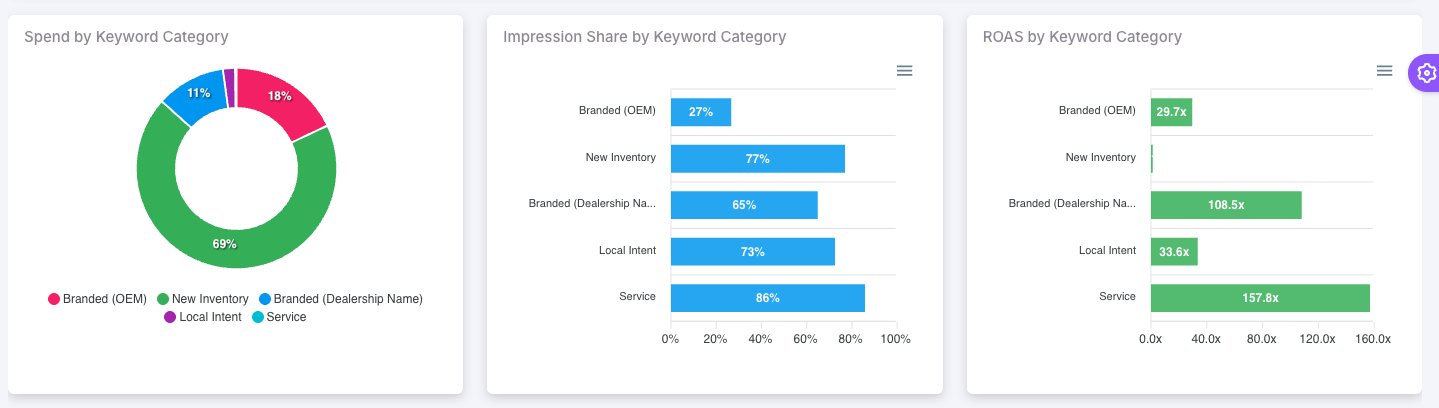
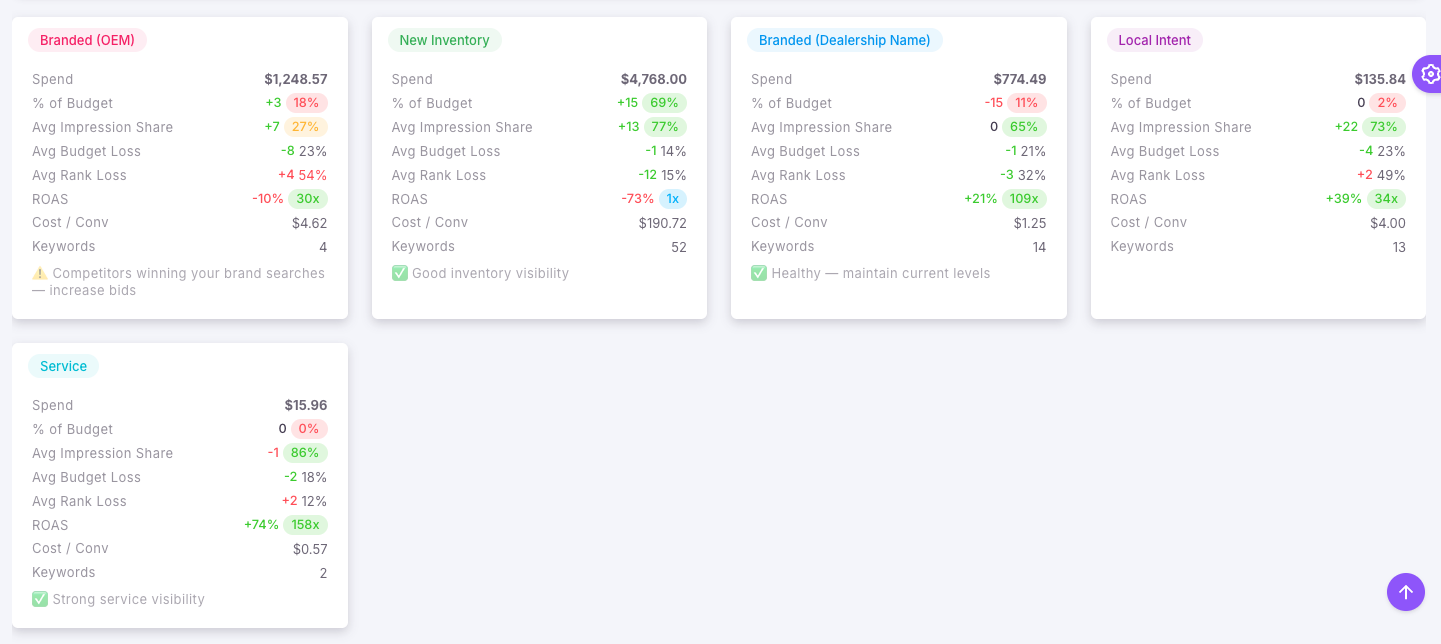
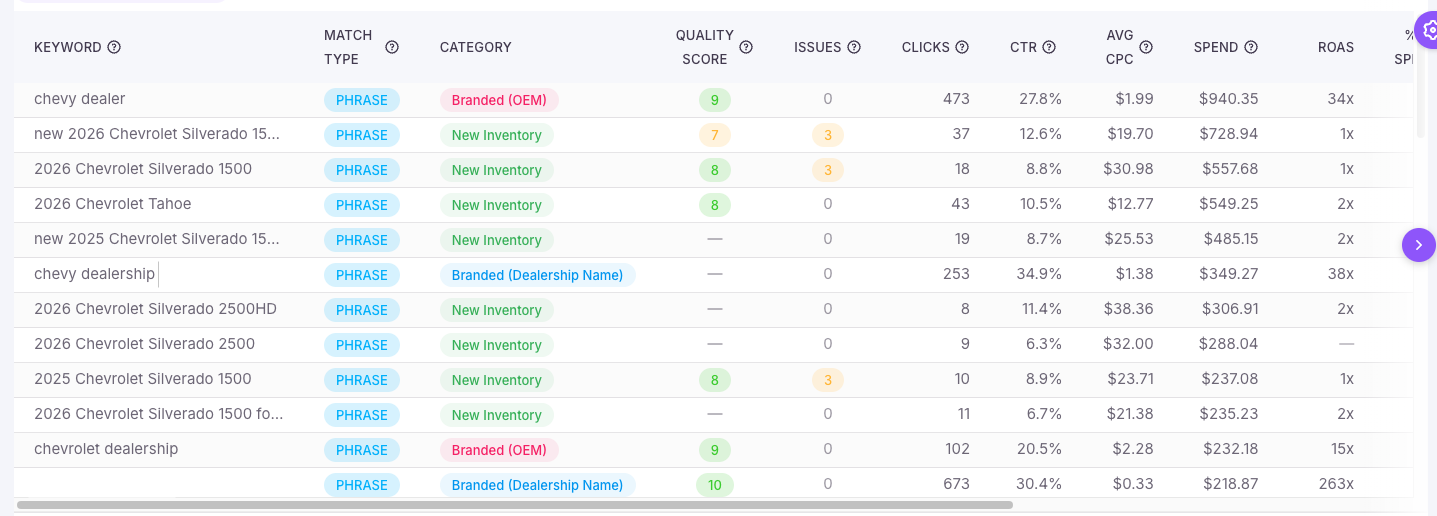
For dealers managing a single location, the SEM Keywords tab gives a complete picture: category cards showing spend, ROAS, impression share, and how each metric is trending versus the prior period. A keyword table below lets you filter by category instantly — see every Local Intent keyword, every Conquest keyword, every Branded term — sortable by spend, impression share, or ROAS.
For marketing directors and agencies managing multiple rooftops, the SEM Group View shows every store in a single table. Each cell shows that store's spend percentage for that keyword category, color-coded against its strategy targets. Green means on strategy. Red means off. The group average sits at the bottom as a benchmark.
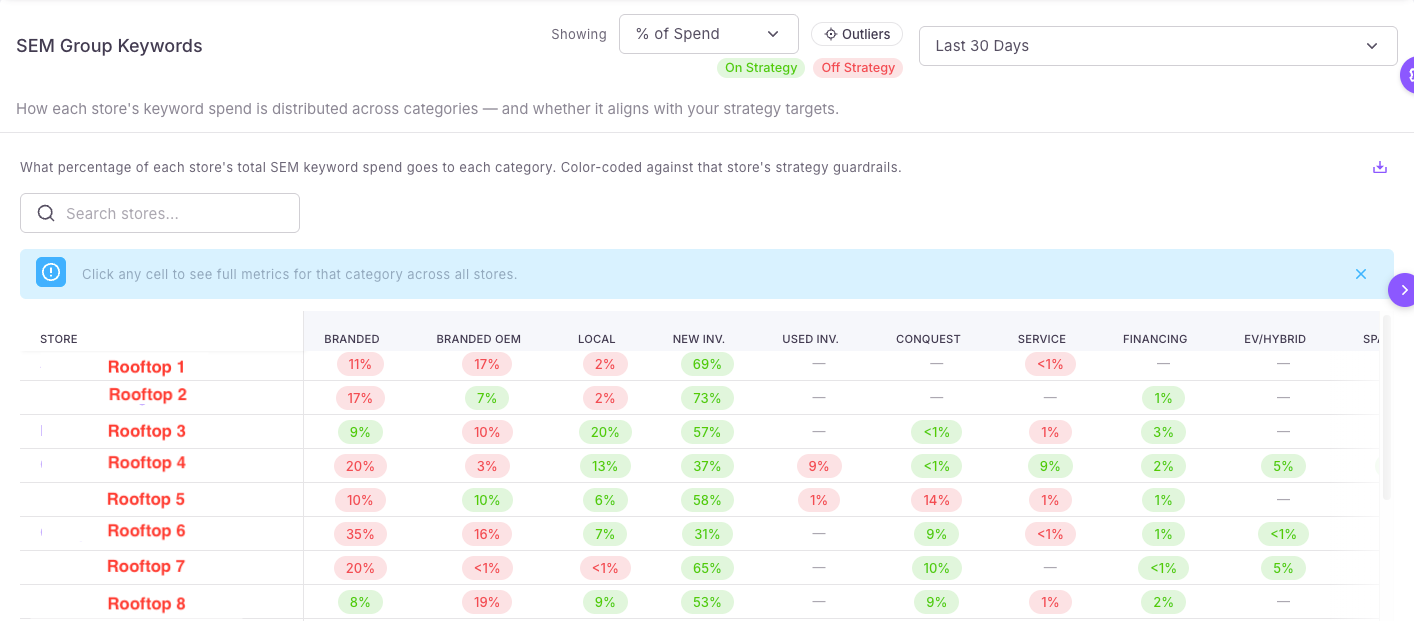
Clicking any cell opens a drill-down that ranks every store by that category's performance — useful for spotting which locations are consistently over-investing in Conquest, or which stores have almost no Service keyword presence at all. From there, you can navigate directly into any store's keyword detail for a closer look.
What Changes When You Can See This
The budget conversation gets more specific. Instead of reviewing a campaign-level spend summary, you're looking at what each dollar is actually buying — and whether that matches your strategy. Categories that are creeping out of range surface automatically as alerts, before they become significant problems.
For marketing directors managing a group, the monthly review goes from pulling reports store by store to opening one screen and scanning for red. Problems that would have taken days to surface now show up immediately.
And for agencies doing good work, this is a tool that proves it. A clean Group View — stores consistently hitting their strategy targets — is one of the clearest ways to demonstrate that a budget is being managed intentionally.
Getting Started
Strategy Guardrails are available now in the SEM Keywords tab. Default targets are pre-loaded based on what we've seen work across hundreds of dealer accounts — you can accept them as a starting point or adjust them to match your specific goals from day one. Your keyword classifications are already running in the background.
Log in to Dealer Insights and check the SEM Keywords tab for your stores today.
Questions? Talk to your Dealer Insights account manager.
Semantic Keyword Footer
This content is relevant to automotive marketing managers, general managers, and dealer principles focusing on: [DealerInsights] | [Vendor Accountability] | [SEM Audit] | [Cost Per Lead (CPL)] | [VDP Engagement Score] | [Automotive Digital Marketing] | [Conquest Strategy]
© 2026 Dealer Insights, LLC